Integrations / Prometheus
Connect
Prometheus
with ToolJet
ToolJet lets you integrate Prometheus to fetch and visualize real-time and historical metrics. Build custom monitoring dashboards and track system health without coding.


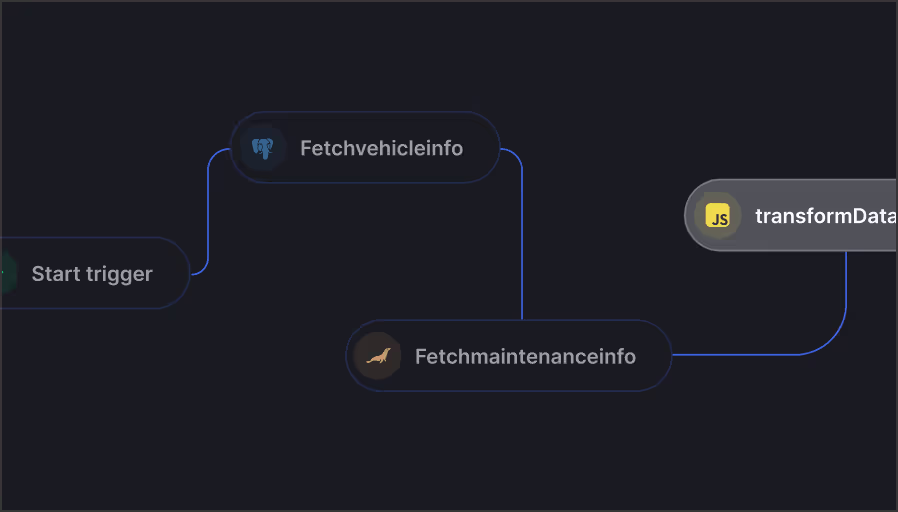
Available actions with ToolJet and Prometheus integration
ToolJet's integration with Prometheus supports various operations:

Instant Metrics Querying
Execute PromQL queries to fetch current metric values and monitor system health in real-time.

Historical Data Analysis
Perform range queries to analyze performance trends over time and generate visual reports.

Advanced Query Control
Customize queries with timeouts, result limits, and flexible PromQL expressions.

Real-Time Monitoring
Build live dashboards with auto-refreshing data and configure alerting systems based on thresholds.

Data Visualization
Transform raw metrics into interactive charts and graphs tailored to your monitoring needs.
Why use ToolJet with Prometheus

AI-powered app building
Build internal tools, workflows, and AI agents in hours using plain English. Go from idea to production with AI-generated apps, data models, and instant debugging.
Enterprise-grade security and compliance
Stay secure with SSO, RBAC, audit logs, encryption, and compliance standards like SOC2, ISO 27001, and GDPR. Deploy your way: cloud, on-prem, or hybrid.
Production-ready database and integrations
Skip setup hassles with instant PostgreSQL and pre-built integrations for AI, databases, storage, and APIs.
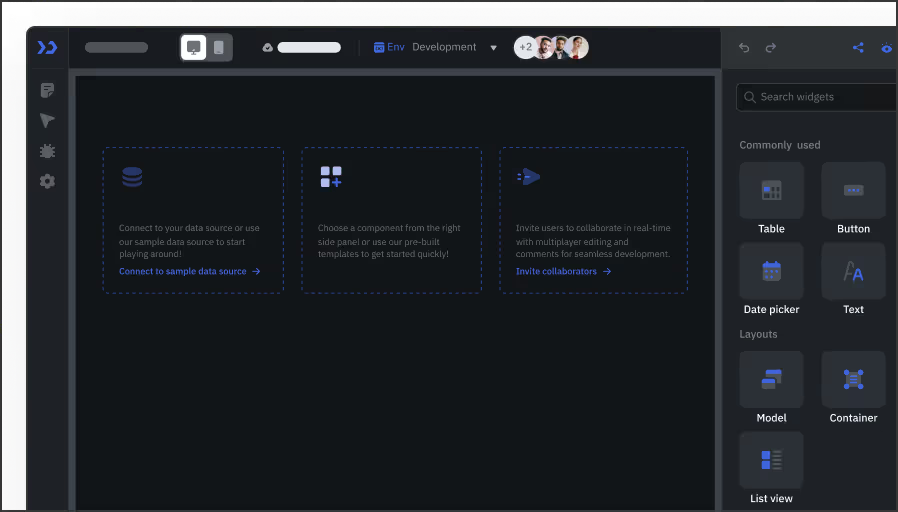
Components and environment management
Speed up development with 60+ pre-built components and manage releases across dev, test, and production environments.
Flexible development options
Use no-code visual builders, or dive into low-code, and switch seamlessly as your needs evolve. You have full control, and there is no lock-in.
JavaScript and Python
Write custom logic and data transformations using JavaScript or Python, flexible scripting built right in.


Frequently asked questions
1. What is Prometheus and how does it work?
Prometheus is an open-source monitoring toolkit that collects time series data and supports powerful querying via PromQL, enabling reliable and scalable system monitoring.
2. How can I integrate Prometheus with PagerDuty, Datadog, or Opsgenie?
Prometheus supports alertmanager integrations that allow you to forward alerts to tools like PagerDuty, Datadog, and Opsgenie for streamlined incident management.
3. What is the process to integrate Prometheus with Grafana?
Prometheus can be connected with Grafana by adding it as a data source, allowing you to visualize metrics and create comprehensive dashboards.
4. Can Prometheus be integrated with Spring Boot applications?
Yes, Prometheus can be integrated with Spring Boot via the Micrometer library, which exposes application metrics in a format Prometheus can scrape.
5. What are the common integrations for Prometheus with platforms like GitLab, Elastic, Dynatrace, and New Relic?
Prometheus integrates with these platforms to provide enhanced monitoring, alerting, and visualization capabilities, often through exporters or direct API connections.


No credit card required
14-day free trial
Deploy in your cloud
Contact us